Onboarding Flow
01
Splash Screen
App Launch
🌱
EcoTrack
Personal Carbon Tracker
→
02
Onboarding 1
Track Your Impact
01 / 03
Track Your Impact
🌍
Get Started
→
03
Onboarding 2
Build Habits
02 / 03
Build Habits
🔥
Continue
→
04
Onboarding 3
See Insights
03 / 03
See Your Data
📊
Start Tracking
→
05
Login
Sign In
🌱
EcoTrack
Welcome Back
EMAIL
PASSWORD
Sign In
OR
Google
Apple
Core App Flow
06
Dashboard
Home Screen
Good morning,
Alex 🌿
🌱
Today's Footprint
3.2 kg CO₂e
↓ 18% vs average
All
🚗
🥗
⚡
🚲
Cycled to work
Transport
−1.4kg
🥩
Red meat lunch
Food
+2.1kg
→
07
Log Activity
Track Emission
←
Log Activity
🚗
Transport
🥗
Food
⚡
Energy
🛒
Shopping
Choose Meal Type
🥗
Plant-based
🐔
Chicken
Est. footprint
0.8 kg
→
08
Success
Logged!
✓
Activity Logged!
Plant-based meal saved CO₂
−0.8 kg
CO₂ saved today
Back to Home
Analytics & Profile
09
Insights
Analytics
Your Insights
Weekly overview
Week
Month
Year
M
T
W
T
F
S
S
Transport
Food
Energy
→
10
Habits
Habit Tracker
My Habits
12-day streak 🔥
🚲
Cycle to Work
75%
🥗
Plant-Based Day
60%
🚲
Cycled to Work
12 day streak
✓
🥗
Plant-Based Meal
8 day streak
✓
♻️
Recycled Waste
5 day streak
+ Add New Habit
→
11
Profile
User Settings
🌱
Alex Chen
eco-warrior
−32%
Reduction
12🔥
Streak
8
Badges
🔔
Notifications
›
🎯
Goals
›
📊
Data Export
›
Sign Out
→
12
Sign Out
Confirmation
👋
Sign Out?
Your progress is saved and synced to the cloud.
Yes, Sign Out
Stay In App
Click any screen to jump to it in the prototype ↑ · EcoTrack · 12 Screens · iPhone 15 Pro (390×844)
Screens
Onboarding
Core App
Analytics
🌱
EcoTrack
Personal Carbon Tracker
01 / 03
Track Your
Impact
Impact
See exactly how your daily choices, from meals to commutes, affect your personal carbon footprint in real time.
🌍
02 / 03
Build
Habits
Habits
Streak mechanics, daily reminders, and micro-goals make low-carbon living feel natural, not like a chore.
🔥
03 / 03
See Your
Data
Data
Beautiful charts and insights show your progress, compare you to city averages, and celebrate every win.
📊
🌱
EcoTrack
Track. Reduce. Thrive.
Welcome Back
Forgot password?
OR CONTINUE WITH
Don't have an account? Sign up free
Good morning,
Alex 🌿
🌱
Today's Footprint
3.2kg CO₂e
↓ 18% vs your average
12🔥
Day Streak
🏠 All
🚗 Transport
🥗 Food
⚡ Energy
🛒 Shopping
Today's Activity
+ Add
🚲
Cycled to work
Transport · 8:30 AM
🥩
Red meat lunch
Food · 12:15 PM
💡
Solar energy used
Energy · Auto-logged
+ Log Activity
Choose Category
🚗
Transport
Car, bus, flights, cycling
🥗
Food
Meals, groceries, diet
⚡
Energy
Home, heating, cooling
🛒
Shopping
Clothes, electronics
Meal Type
Estimated Footprint
for this activity
0.8 kg CO₂e
Add a note (optional)
✓
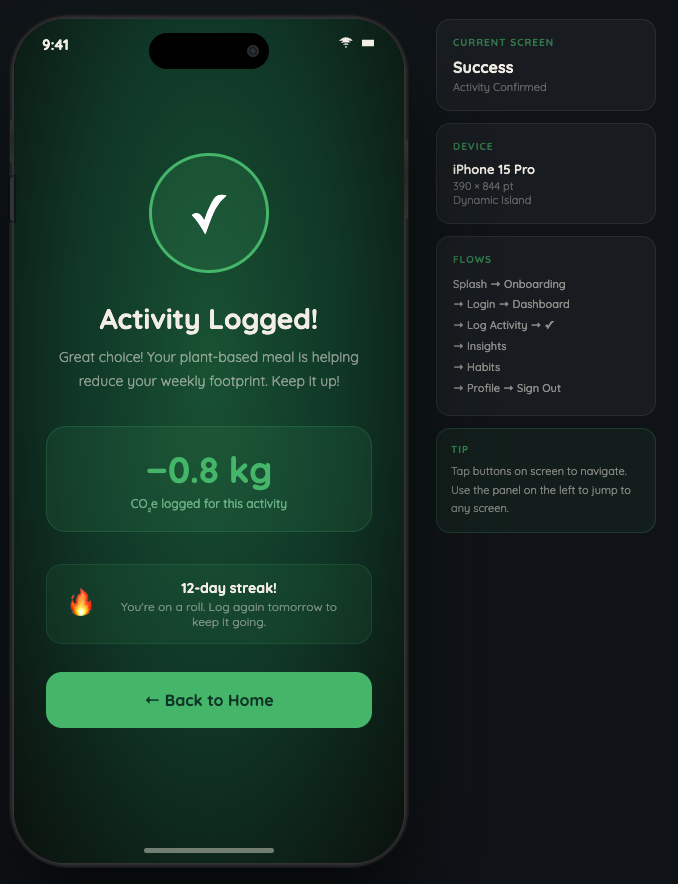
Activity Logged!
Great choice! Your plant-based meal is helping reduce your weekly footprint. Keep it up!
−0.8 kg
CO₂e saved compared to red meat
🔥
12-day streak!
You're on a roll. Log again tomorrow to keep it going.
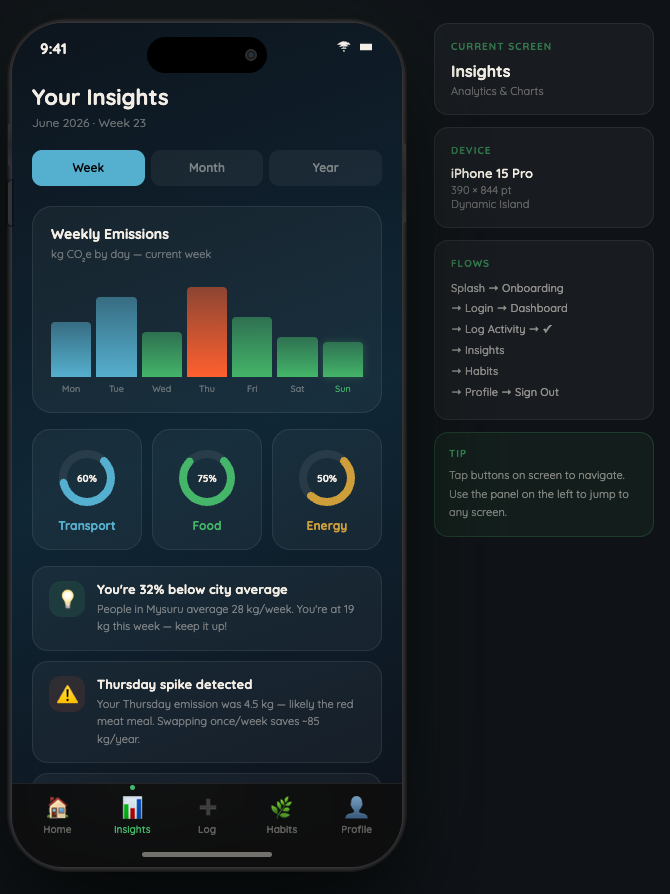
Your Insights
June 2026 · Week 23
Weekly Emissions
kg CO₂e by day, current week
Mon
Tue
Wed
Thu
Fri
Sat
Sun
Transport
Food
Energy
💡
You're 32% below city average
People in Mysuru average 28 kg/week. You're at 19 kg this week, keep it up!
⚠️
Thursday spike detected
Your Thursday emission was 4.5 kg, likely the red meat meal. Swapping once/week saves ~85 kg/year.
🚲
Cycling streak: 12 days
You've saved 16.8 kg CO₂ by cycling instead of driving this streak.
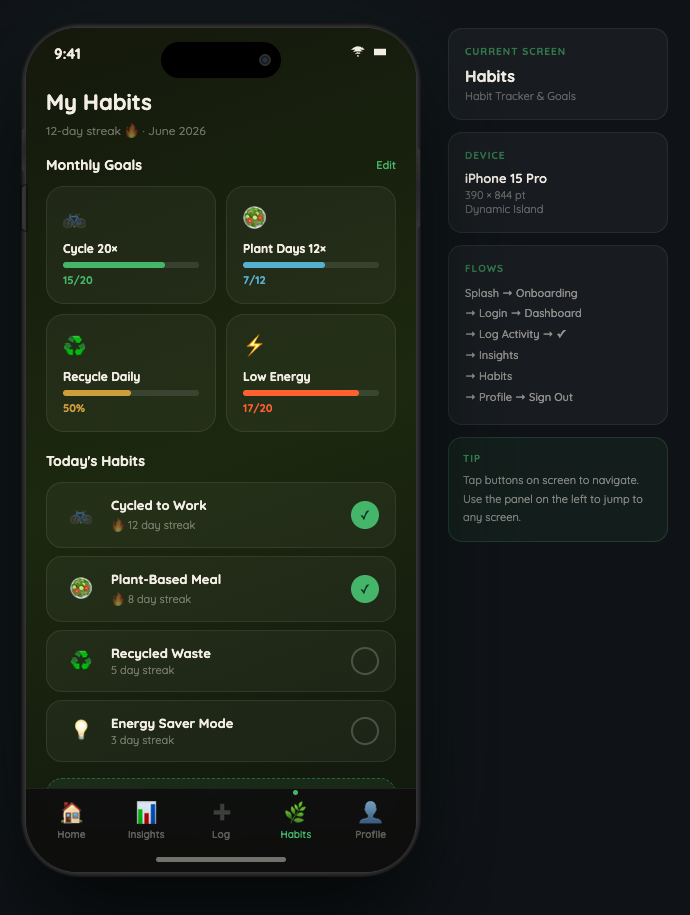
My Habits
12-day streak 🔥 · June 2026
Monthly Goals
Edit
🚲
Cycle 20×
15/20
🥗
Plant Days 12×
7/12
♻️
Recycle Daily
50%
⚡
Low Energy
17/20
Today's Habits
🚲
Cycled to Work
🔥 12 day streak
✓
🥗
Plant-Based Meal
🔥 8 day streak
✓
♻️
Recycled Waste
5 day streak
💡
Energy Saver Mode
3 day streak
+ Add New Habit
🌱
Alex Chen
Member since Jan 2024 · Eco Warrior
−32%
Reduction
12🔥
Streak
8
Badges
Badges Earned
See All
🌱
First Log
🚲
Cyclist
⭐
7-Day Streak
🔥
Streak Master
🌍
30% Reducer
Settings
🔔
Notifications
›
🎯
My Goals
›
📊
Export Data
›
🌍
Units & Region
›
🔒
Privacy
›
❓
Help & Support
›
👋
Sign Out?
Your progress is saved and synced. You can pick up right where you left off when you return.
Current Screen
Splash
App Launch
Device
iPhone 15 Pro
390 × 844 pt
Dynamic Island
Flows
Splash → Onboarding
→ Login → Dashboard
→ Log Activity → ✓
→ Insights
→ Habits
→ Profile → Sign Out
→ Login → Dashboard
→ Log Activity → ✓
→ Insights
→ Habits
→ Profile → Sign Out
Tip
Tap buttons on screen to navigate. Use the panel on the left to jump to any screen.